• Home
  • Investor Education
    • Essential Tips for Stock Investors
    • Using Passive Investing to Beat the Market
    • Recommended Investment Books
    • Key Things to note in Rights Issues
    • Understanding Reverse Takeovers
    • Stock Split vs Bonus Issue
  • Latest Recommendations
    • Abric Berhad
    • Kejuruteraan Samudra Timur
    • Chuan Hup Holdings
    • Falcon Energy Group
    • Memstar Technology
    • Pacific Century Regional Developments
    • Singapore Healthcare Stocks
    • Macquarie Int Infrastructure Fund
    • IPC Corporation
    • Tiger Airways
    • TSH Corporation
    • Bukit Sembawang Estates
    • HG Metal Manufacturing
    • OKP Holdings
    • Global Investments Ltd
    • Baker Technology Ltd
    • Yongnam Holdings
    • Hupsteel
    • TIH
    • Sysma Holdings
    • Sembcorp Industries
Stock Investment Research with an Asian focus

Memstar Technology Ltd- Time for Company to break the silence

29/6/2015

 
Memstar Technology logo
Recap

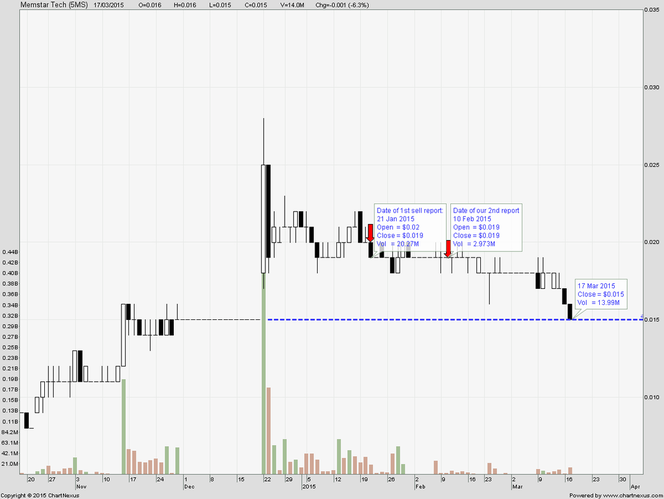
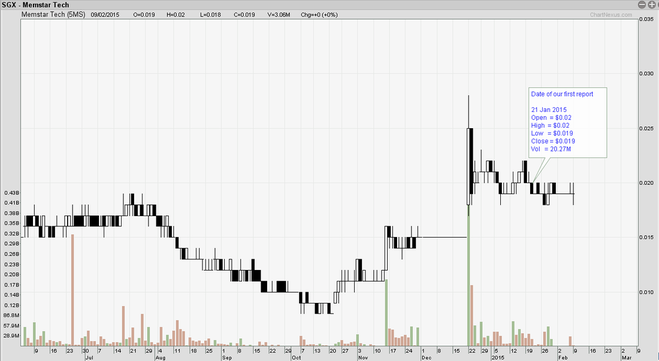
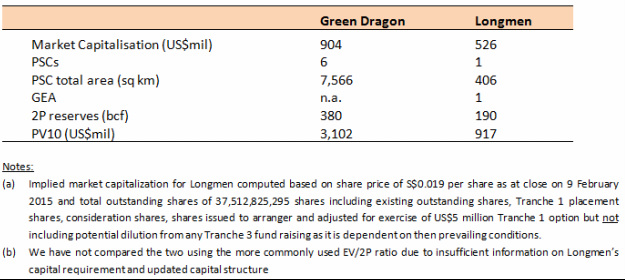
As our readers would recall, we have made multiple warnings beginning from January 2015 (reports 1, 2 and 3) regarding what we see as unsubstantiated optimism over Memstar's proposed US$420 million RTO of Longmen Group Ltd ("Longmen"), a private developer of coal bed methane ("CBM") resources in Shaanxi Province, China. Over the course of the past 5 months, the proposed deal has seen the deadline for Longmen to satisfy its conditions precedent lapsed no less than three times, the last of which fell on 31 March 2015. 

In Memstar's last significant update released on 6 March 2015, it announced that it had gotten a conditional approval from SGX for a 6-month extension of time to meet the requirements for a new listing, i.e. from 11 April 2015 to 11 October 2015. 

However, on 6 April 2015, the Company suddenly suspended the trading of its stock and has since then remained largely silent over both developments on the proposed RTO and its own listing status. 

Our Views and Recommendations

The Company's lack of response so far has been disappointing. Given that the stock has been suspended for more than 2.5 months, we can only surmise that the Company had fallen short of the conditions imposed by SGX for its continued listing.

One can imagine the dismay and anguish that minority shareholders are currently going through over the uncertainty of their investments. We feel strongly that the Company owes it to these shareholders to provide an immediate update of the situation at the very least. Likewise, shareholders should consider taking a proactive approach to seek answers from the Company and its management.

This unfortunate episode should also serve as a warning to investors in other companies with similar profiles: cash companies, which may or may not have announced an RTO deal, with rapidly approaching deadlines for them to meet conditions to continue their listings and trading at levels far above the value of their net tangible assets including cash. Jaya Holdings Ltd and E2-Capital Holdings Ltd are two such companies that come to mind. While the situation with Memstar might not manifest itself with these two counters, investors would do well not to be overly optimistic when pricing in potential upside from RTO deals, especially when completion is far from certain. 

Pacific Century Regional Developments Ltd (PCRD)- Update

5/5/2015

 
Key developments since our first report:

  1. Two weeks after our report published on 16 April 2015, Business Times ran a similar article on 30 April 2015 highlighting the potential delisting of PCRD as well as a possible restructuring of the group:http://business.asiaone.com/news/pacific-century-headed-delisting (note: link is to the said article reproduced on asiaone.com as Business Times operates a paid platform that might not be available to all readers)
  2. In the same two-week period, PCRD's share price has advanced more than 28% to close at $0.445 on 30 April 2015. It has since cooled slightly to $0.435 as at 4 May 2015. 
  3. On 2 May 2015, PCRD released an announcement clarifying that "it is not aware of, and has not received, any proposal in relation to privatisation of the Company. In addition, the Company is not aware of any restructuring plan involving the Company and its subsidiaries."
  4. PCRD has successfully obtained a fresh mandate for share repurchases up to 10% of its shares and gone on to record its first purchase on 29 April 2015 at $0.405 per share, a sharply higher price than its previous purchase at $0.365 per share a week before.   

Our Views

We do not see the company's response as anything more than routine and it does not in our opinion reduce the likelihood of a privatisation happening in the future. It merely confirms that an offer or restructuring proposal has not been tabled or discussed officially as at the announcement date. 

Under the current regulatory regime, there are a few ways that PCRD's privatisation could take place: through a general offer, a scheme of arrangement, a voluntary delisting or a forced delisting by SGX due to low free float (<10%) coupled with an exit offer. Based on current circumstances, we see the last two as the most likely options. Both would require a reasonable exit offer to be tabled and the appointment of an independent financial adviser ("IFA") to opine on the fairness of the offer as stipulated in the SGX listing rules. We note that IFAs tend to benchmark fair value of a company's shares to the market prices of its underlying assets where such values are available as in the case of PCRD. As such, we do not expect any exit offer, if it materialises, to deviate greatly from the fair value computed using this methodology in order to obtain a positive recommendation from the IFA. 

Recommendations

We continue to believe that PCRD is undervalued although we note that the valuation gap between the current market price of $0.435 and the implied fair value of $0.542 which we previously computed has closed significantly to 19.7% (vs 36.4%). Downside risks though, should be limited as the Company has reconvened its share repurchases at a sharply higher price of $0.405 per share lending further support to the share price.  

Pacific Century Regional Developments Ltd (PCRD)- Will Richard Li finally privatise PCRD?

16/4/2015

 
Richard Li (Source: Forbes)
Richard Li
PCRD Key Statistics
PCRD’s share price has doubled over the last 3 years to a multi-year high of S$0.345 as at 16 April 2015 but yet remains very much undervalued. With the Company aggressively buying back its shares and reducing its public float to just above 13%, we think there is a good chance that this will be the year Richard Li finally privatises the Company.

Background

Pacific Century Regional Developments Ltd ("PCRD") has been an integral part of billionaire Richard Li Tzar Kai's empire ever since he acquired control of the SGX-listed company in 1994. Currently, it serves mainly as an intermediate holding company for Hong Kong listed PCCW Ltd, which in turn controls:
  • now TV, Hong Kong's leading Pay TV operator; 
  • PCCW Solution, an IT services leader in Hong Kong and mainland China;
  • 70.8% (92.6%*) of HK-listed Pacific Century Premium Developments Limited ("PCPD"), positioned as a premium property developer with projects in Hong Kong, Japan, Thailand and Indonesia; and
  • 63.1% of HKT Trust and HKT Limited (together "HKT"), Hong Kong’s premier telecommunications service provider and listed in Hong Kong as stapled securities under a business trust structure.

*Note: Even though PCCW holds only 70.8% of the ordinary shares of PCPD, it also owns Bonus Convertible Notes issued in 2012 under an unusual bonus share cum bonus convertible note issue specifically executed to restore the public float of PCPD to more than 25%. The notes have been conferred the same economic rights as the bonus shares and give PCCW an effective economic interest in PCPD of 92.6% instead of 70.8%. 
PCCW group structure and services
Figure 1. PCRD Group Structure and Services

For FY2014, PCCW recorded total revenue of HK$33.27 billion and a profit after tax (PAT) and minority interests of HK$3.31 billion. However, this includes a gain of HK$1.31 billion on disposal of Pacific Century Place, Beijing by its subsidiary PCPD, without which the adjusted PAT would have been around HK$2.00 billion. Further, we estimate that HKT contributed approximately HK$1.93 billion or almost 97% of the adjusted PAT.

Crown Jewel HKT

Of all the assets within the PCRD group, the 63.1% owned HKT (previously known as Hong Kong Telecom) is by far the largest and most profitable.

HKT was first acquired by PCCW in August 2000 at the height of the dot-com bubble for over an estimated US$28 billion in cash and shares. Then, PCCW beat out a rival bid from Singtel, amidst rumours of Beijing's concerns over potentially sensitive telecom assets falling into foreign hands. The acquisition did not initially turn out well and saddled PCCW with massive debts. In subsequent years, PCCW tried disposing of various assets to raise cash in order to pare down its debts including ironically that of HKT's assets. Eventually, PCCW managed to spin off the HKT assets into a trust listing on the Hong Kong Stock Exchange in 2011, raising US$1.2 billion in the process.

HKT is the undisputed leader in telecommunication services in Hong Kong. While it has long been the dominant player in the fixed-line and broadband services segments, its acquisition of CSL New World Mobility Ltd (“CSL”) from Australia-based Telstra in May 2014 for US$2.4 billion further catapulted it to the No. 1 position in mobile services as well. In Hong Kong, it has a market share of >60% for both fixed line and broadband segments and a 31% market share in the mobile segment.

Since listing in November 2011, HKT has performed well operationally. For the year ended 31 December 2014, it recorded total revenue of HK$28.8 billion and profit after tax of HK$ 3.1 billion, registering strong growth in both primarily due to a maiden 7.5 months contribution from the newly acquired CSL. Adjusted funds flow (defined as EBITDA minus capital expenditures, customer acquisition costs, license fees paid, taxes paid, net finance costs paid, and adjusted for changes in working capital), which HKT uses as a gauge for dividend distribution, has also grown steadily from FY2011 to FY2014 at a CAGR of 12%. With a first full-year contribution from CSL in 2015, top and bottom line as well as adjusted funds flow are expected to improve further. 
HKT historical performance chart
Figure 2. HKT's financial performance from FY2011 to FY2014

Other Business Segments

Although the other business segments such as PCCW Solutions and PCCW Media generated sizeable revenues, their contributions have been dwarfed by that of HKT. For FY2014, all the other business segments outside of HKT contributed just 14% of PCCW's total revenues and less than 1% of the group's EBITDA. This means that PCCW is at present in effect a proxy for HKT. That said, both PCCW Media and PCCW Solutions have continued to grow steadily and offer good growth opportunities.

PCCW Media, which includes the Pay-TV business operated under the brand "now TV", has been increasing its own entertainment production following a successful first TV drama series production "The Virtuous Queen of Han", which reached 38 million viewers in China. now TV's international footprint also continued to widen through affiliate partnerships to distribute now TV channels across countries in Asia and North America, with the latest addition being Taiwan.

PCCW was also recently awarded a 12-year licence to operate two free to air TV broadcast channels, becoming the first in 40 years to be awarded a new licence by the Hong Kong government. However, with the market dominated by a strong incumbent in TVB, we think the free TV licence is unlikely to contribute meaningfully to PCCW in the near future.

PCCW Solutions, an IT services leader in Hong Kong, has grown revenue and EBITDA by CAGR of 17% and 20% respectively over the last 3 years and continues to secure healthy orders. As at 31 December 2014, it has secured orders worth US$730 million (about 1.7x its FY2014 revenue) although we note that this is down slightly from the corresponding secured orders of US$819 million as at 31 December 2013.

PCRD trading at a steep discount to the value of its underlying assets

PCRD has only two significant assets on its books, its 21.8% stake in PCCW and a direct holding of 131,626,804 Share Stapled Units in HKT.

PCRD last traded at S$0.345 per share as at 16 April 2015, giving it a market capitalisation of S$945 million. Although its stake in PCCW is carried on its books at S$645 million, it is worth around S$1.45 billion on the market based on the closing price of HK$5.11 per share. In addition, PCRD's direct holding of Share Stapled Units in HKT is worth S$240 million. This means that at the current price, investors buying into PCRD are practically buying its controlling stake in PCCW as well as units in HKT at a huge 44.2% discount off the market value.  

To further establish that PCRD is indeed trading at a deep discount to its intrinsic value, we look at its key underlying asset, PCCW and compare its valuation against regional peers:
PCCW regional comparable companies
Figure 3. PCCW vs regional peers (Source: Bloomberg, company)

As you can see above, PCCW’s current valuation is in line with its peers based on both PE ratio ("PER") and dividend yield. However, to be conservative, we decided to peg PCCW to its implied valuation based on the highest dividend yield (4.5%, Starhub) and lowest PER (15.7x, China Mobile) of its peer group. 
Picture
Figure 4. Fair value computation of PCRD

This resulted in a fair value price for PCCW of HK$4.38 per share. Based on this new fair value price, we established an implied fair value for PCRD of S$0.542 per share. The current price of S$0.345 is thus at a steep discount of 36.4% to its fair value, which we do not think is justified.  

Aggressive share buyback returning value to shareholders in lieu of dividends while concurrently shrinking public float

PCRD has embarked on an aggressive share buyback programme in the last one year, acquiring and cancelling 9.99% of its own shares equivalent to 303,932,200 shares in total and almost maximising the 10% limit allowed under its share purchase mandate approved at last year’s annual general meeting. While share buybacks are not uncommon, we note that this is one of the rare instances in Singapore where any company has actually bought back close to the maximum amount of shares allowable under its annual share purchase mandate. As a result of the aggressive purchases, the public float has shrunk to 13.1%, a level dangerously close to the minimum 10% limit stipulated by SGX.

We note that the Company has proposed a further renewal of the share purchase mandate for its upcoming shareholders' meeting on 24 April 2015. In its latest circular for the shareholders' meeting, it specifically catered for the scenario of a maximum purchase of 3% of its total outstanding shares. We see this as an indication that the Company is prepared to resume buying back its shares aggressively until such time when the public float is close to the minimum of 10%.    
PCRD share purchase mandate FY2015
Figure 5. Extract of share purchase mandate from PCRD circular

Delisting imminent?


One other direct effect of the aggressive buybacks has been the tightening of Richard Li and his Pacific Century Group's control on PCRD. 
Richard Li's shareholdings % in PCRD has increased
Figure 6. Richard Li’s control over PCRD on 15 April 15 vs 14 Mar 14

With Richard Li and the Pacific Century Group controlling almost 87% of PCRD’s total shareholdings and with the shares trading at a steep discount to its underlying intrinsic value, we think there is a good chance that this could be the year that Richard Li finally pulls the privatisation trigger. We see little justification now for PCRD as a de facto intermediate holding company within the Pacific Century Group to remain listed and incur unnecessary compliance and listing costs.

PCRD should continue to return sustainable value to shareholders even if privatisation does not take place

While we see a good chance of the Company being privatised, we also considered the possibility of PCRD remaining listed despite the low public float. Under this scenario, we think that the Company could possibly resume paying cash dividends to shareholders.

For FY2014, PCRD returned almost S$76.9 million of capital through share buybacks alone. With the free float at only 13%, it is only a matter of time when the Company maxes out on its share buyback limits. What next then? For a start, we should note that the PCRD is an investment holding company with no other core operations on its own. This means that it does not have much need for capital or operating expenditures other than to maintain its listing and other corporate expenses.

Its main sources of cash income are derived primarily from its stake in PCCW and its holdings in HKT. 
PCCW has consistently paid out dividends
Figure 7. PCCW's EPS and DPS from FY2010 to FY2014 (^Note: Payout ratio and EPS for FY2014 has been adjusted to account for the one-time gain from the disposal of Pacific Century Place, Beijing by PCCW's subsidiary PCPD)

PCCW has consistently paid out a good chunk of its earnings as dividends (payout ratio >70%) over the last 4 years. In FY2014, its full year dividend payouts amounted to HK 20.2 cents per share. This translates to S$57.5 million worth of dividends for PCRD. In addition, PCRD also received S$8.9 million in dividend income from HKT directly. This gives it a potential cash income of S$66.4 million annually if the dividend payments are sustained. As an illustration, if all these cash were to be paid out as dividends to PCRD shareholders, it would translate to an annual dividend yield of about 7.0%.

As we previously indicated, the bulk of PCCW's earnings come from HKT and HKT's earning should continue to grow in the near future with the full consolidation of CSL in FY2015. Hence, we believe that both HKT and PCCW's dividend payments are sustainable.

While there is no assurance that PCRD will elect to receive its dividends from PCCW in cash (it opted for scrip dividends in FY2014 and cash in the preceding two years), or that it will resume paying cash dividends in future, the benefits from the cash income from PCCW and HKT should eventually accrue to shareholders in one form or the other. 

Recommendations

We believe PCRD to be deeply undervalued. Based on its latest closing price of S$0.345 per share as at 16 April 2015, it is trading at a steep discount to the market value of its underlying stakes in PCCW and HKT. Even if we were to peg the value of its stake in PCCW to the lowest valuation metrics within its peer group, PCRD would still be trading at a discount of 36.4% to the conservative implied fair value of S$0.542 per share.

With the Company also aggressively buying back its shares and boosting Richard Li's control to 86.7% while simultaneously reducing public float to 13.1%, we also believe this year to be an opportune time for Richard Li to finally pull the privatisation trigger.

Should Richard Li elect not to privatise the Company, shareholders would also benefit, in one form or the other, from PCRD's stake in PCCW and cashcow HKT. Sans share buybacks, if the Company elects to pay out its cash income derived mainly from the dividends collected from PCCW and HKT, we think that the Company would be able to sustain an attractive dividend yield of about 7.0% based on the last traded price of S$0.345 per share, further reinforcing our conviction that the stock is selling at far below its fair value.

Key Risks

Further share buybacks will heighten trading liquidity risks going forward. This is somewhat mitigated by the fact that the Company has at present a sizeable share base of more than 2.7 billion, such that even a minimum 10% float amounts to more than 270 million shares. This should be able to sustain some healthy trading activity going forward.

PCRD has high asset concentration risks as its prospects are predominantly tied to HKT. However, HKT's business model has proven to be resilient over the years especially given its market leadership position in Hong Kong. This should help to ensure that PCRD's earnings going forward remain relatively stable.  

(SGD:HKD X-rate of 5.70 assumed)

Memstar Technology Ltd (Update no. 2)- One last chance perhaps?

18/3/2015

 
Events since last update on 10 February 2015 (link)

Memstar Technology Ltd announced on 6 March 2015 that it had entered into a 2nd supplemental agreement to extend fulfillment of key conditions precedent, that were supposed to have first been fulfilled by 31 January 2015 and then by 28 February 2015, to 31 March 2015. These conditions include Longmen Group Ltd (or "Target") successfully completing Tranche 2 Fundraising of US$15 million and the Target entering into an off-take agreement with Petro China and/or CNPC for the purchase of the Target’s coal bed methane.

Memstar also announced that it had successfully obtained a 6-months extension of time to meet the requirements for a new listing, i.e. from 11 April 2015 to 11 October 2015. The extension is, however, subject to the following conditions:

  1. The submission to SGX of the Proposed RTO application of Longmen by 30 April 2015; and
  2. Memstar providing quarterly updates of key milestones, via SGXNET, on its progress in completing the Proposed RTO by September 2015.

Our Views

The conditional extension granted by SGX effectively means that the latest extension of time by Memstar for Longmen to fulfill the conditions precedent may well be the final one. Should Longmen fail to meet these conditions precedent by 31 March 2015, Memstar is unlikely to be able to meet the conditions set by SGX to extend its own listing status to 11 October 2015.

Such a scenario would pose a major setback to existing shareholders as we have previously warned. Recall our estimates that the Company only has an NTA backing of S$0.003. In the event that it is forced to delist, shareholders would probably not be able to monetise their shares for much more than this amount.

As we have also highlighted previously, the valuation of Longmen appears rich compared to that of its larger LSE-listed competitor, Green Dragon Gas Ltd. The most ideal scenario for Memstar shareholders would therefore be for a cut-price deal to be negotiated and consummated with Longmen. However, given the dire  circumstances, a deal based on the current price is still better than none for shareholders. Indeed, Memstar may well choose to waive the existing conditions precedent just to push the deal through.

Share price of Memstar is $0.015 as per close of market on 17 March 2015, down 25% from $0.020 from our first report issued on 21 January 2015 warning investors that the price then was unjustified. (See chart below)
Picture
Recommendations

Even though the share price has declined to $0.015, where it was at before the RTO announcement, we would still caution investors to stay away given the uncertainties surrounding the deal and Memstar's own listing status. We do not discount any positive news or developments from the RTO giving a temporary boost to Memstar's share price. However, any potential gain has to be weighed against a likely loss of 80% in value (share price of S$0.015 vs S$0.003 NTA backing) should the deal fall through.

Falcon Energy Group Ltd- What now for its CH Offshore stake?

10/3/2015

1 Comment

 
Picture
Picture
In our report on Chuan Hup, we suggested that Falcon Energy Group Ltd’s (“FEG”) successful takeover offer for CH Offshore Ltd ("CHO"), which resulted in CHO becoming its 86.7% owned subsidiary, could be a win-win-win situation for all three companies involved. In this report, we take a closer look at FEG and assess its options with respect to its newly acquired CHO stake.

Introduction to FEG

History

FEG has come a long way ever since it morphed from the then Sembawang Music Holdings Ltd ("SMH"), a small music retail business listed on SGX SESDAQ (n.k.a Catalist), via a 2-stage reverse takeover process into an established Oil and Gas ("O&G") services provider.

The transformation began in May 2006, when Tan Pong Tyea, the current majority shareholder of FEG and a long-time veteran of the oil and gas industry, acquired a 55.0% stake in SMH, triggering a mandatory takeover offer and gaining control of the listed entity. SMH subsequently became known as Falcon Energy Group Ltd. With Tan at the helm, FEG began its initial foray into the new core business of Marine and Oil and Gas services.

The new business gained steam when Tan injected his privately held Oilfield Services Company Limited, a well-established company started in 1983, into FEG. The consideration of S$229 million was paid entirely in newly issued FEG shares, further tightening Tan's grip on FEG. The legacy music business was also disposed of along the way to SMH's former controlling shareholder.  

This series of moves laid the foundation for what FEG is today. 

Core Businesses

FEG currently has 5 main business divisions catering to customers in different stages of the exploration and production phase in the upstream O&G sector. The services offered under each division can either be offered individually or integrated and customised to cater to each customer’s specific requirements. The 5 divisions are listed below:

  • Marine Division: Owns and operates a fleet of 22 offshore support vessels ("OSVs") that mainly service customers in the production phase of O&G projects. These include one of the largest fleet of Accommodation Work Barges (13) in the region alongside 3 Multi-functional Support Vessels, 1 Anchor Handling Tug and 5 other OSVs.  The Marine division provides a wide range of platform supply and engineering services. 
  • Oilfield Services Division: Provides services such as agencies, logistics, procurement and other general support activities to customers like O&G majors, national oil companies (NOCs), contractors and shipyards globally. This division also provides engineering and consultancy services for the construction of oil rigs and OSVs.  
  • Oilfield Projects Division: Provides O&G project related services of varying nature such as building and leasing of specialised seismic vessels and marketing agency for oil companies, ranging from small facilities to multi-million dollar heavy oil facilities. 
  • Drilling Services Division: Relatively new division started in 2011 to provide drilling and related services to the O&G majors, NOCs and O&G contractors. Through this division, the group has been building up a modern fleet of high specification jack-up rigs via joint ventures (“JVs”) with its strategic partners. The JVs currently have a total of 5 rigs on order: 4 GustoMSC CJ50 and a Keppel FELS Super B Class jack-up. All 5 rigs were ordered in 2013 and are expected to be delivered between mid-2015 to mid-2016. FEG has an effective ownership stake of 25% in these rigs. The Group previously also held stakes in 2 more GustoMSC CJ46 rigs ordered in 2011 but both were sold to China Oilfield Services Limited before they were delivered, netting FEG substantial gains for FY2014. 
  • Resources Division: Set up in 2010 to create another energy-related stream of revenue for the group. FEG has acquired the commercial rights to three coal-mining concessions in East Kalimantan, Indonesia. According to FEG's annual report, production of coal was expected to commence in 2014 although we have not seen evidence of this happening as yet: in its latest Profit & Loss statement for the 9 months ending 31 December 2014, 100% of FEG's revenue came from Marine, Oilfield Services and Oilfield Projects divisions. FEG remains on the lookout for further coal acquisitions.   
Picture
Figure 1: FEG's services cover the full spectrum of exploration and production phase in the upstream O&G sector. Source: FEG

Recent Financial performance

FEG has in recent years managed to successfully execute its multi-prong expansion plans with both top and bottom line growing more than 4 times since the downturn in FY2010 to US$350.8 million and US$60.8 million respectively in FY2014. We note though, that revenue and earnings for FY2014 were boosted by the disposal of the two GustoMSC CJ46 rigs, without which they would still have been approximately US$222.4 million and US$30.5 million respectively. Although FEG does not appear to have a consistent dividend policy, they have paid dividends of between 0.5 to 1.5 Singapore cents in 4 out of the last 5 years. 
Picture
^FEG changed its financial year from December to March resulting in a 15-month financial period straddling FY2012 and FY2013. Profit After Tax and MI adjusted for FEG’s share of a one-off writedown on CHO’s receivables of US$43.95 million during FP2013 of which the outcome is still pending.


Figure 2: FEG's performance in recent years has been on the uptrend. Source: FEG

At the current share price of S$0.27 and implied market capitalisation of S$218.6 million, FEG is trading at a valuation of 5.2 times FY2014 earnings adjusted for gains from disposal of the two rigs, with an above average dividend yield of about 5.6%.  As with all other oil and gas services companies, we expect operational environment going forward to remain challenging although the effect of lower oil prices have yet to manifest itself in the latest reported financial period of 9M2015 ending 31 December 2014 with profit after tax and minority interests already at US$34.2 million. 

CHO shareholders' deadlock finally broken- expect more synergies

FEG had not been able to exert any meaningful control over CHO ever since it acquired its initial 29.1% stake from Scomi Marine Berhad (n.k.a Scomi Energy Berhad) back in 2010, as witnessed by it not having any representatives in a key executive role on board of CHO- FEG Chairman Tan and CFO Gan Wah Kwang are both non-executive board members. This was largely due to Chuan Hup and its associates controlling a higher 35.1% stake in CHO. Now that Chuan Hup is no longer in the picture, we should start to see more integration between CHO and FEG's operations.

We expect CHO's fleet of 15 AHTS, including seven of the 12,240 bhp variety built in Japan, to complement FEG's fleet of mainly Accommodation Work Barges nicely by significantly expanding the scope of services its marine division provides and increasing its fleet capabilities. For more on the 2 types of OSVs, see Figure 3 below. There should also be increased service cross-selling opportunities going forward with the enlarged clientele base as well as geographical coverage. 
Picture
Figure 3: FEG's AWBs vs CHO's AHTS. Source: Intership, FEG, CHO.

FEG's gearing ratio likely to have risen significantly- room to optimise capital structure

As at 31 December 2014, FEG had cash of US$88.9 million vs total debts including notes payable of US$239.4 million, giving it a gross gearing and net gearing of about 0.82 and 0.51 respectively. The debts are mostly secured[i] against its existing vessels and leasehold office properties.

FEG had also previously disclosed its intention to fund the CHO takeover using bank borrowings and internal cash resources. Assuming a Loan to value ("LTV") ratio of 70%[ii], we estimate that an additional US$106.7 million of debts would have been added to date and the gross and net gearing would have ballooned to 1.10 and 0.80 times respectively despite the larger equity base due to consolidation of CHO's accounts. This is on par with its peer companies:
Picture
Figure 4: FEG's estimated proforma gearing is in line with its peers.

However, despite the seemingly manageable consolidated gearing, we note that all the debts (estimated at US$347.6 million) are now being carried on FEG's books. On the other hand, a large portion amounting to US$69.5 million of the combined cash balance is carried on CHO's debt-free books.

It is important to make this distinction, as while CHO is now majority controlled by FEG, they are fundamentally two separate listed entities each managed by its own board of directors. Cash carried on CHO's balance sheet for example could not be used to pay FEG debt or service FEG interest unless distributed upwards to FEG via say dividends. Thus, we believe that there is room for FEG to carry out a capital structure optimisation exercise and lower its own gearing, especially with the market expecting an interest rate hike later this year.

Strategic options for FEG

We believe FEG may undertake the options put forth below to optimise its capital structure:

Option 1: Gear up CHO’s balance sheet to repay borrowings at FEG

One possible option is for CHO to take on borrowings against its balance sheet and distribute the loan proceeds as well as excess cash on its books to its shareholders in the form of a special dividend. FEG can then use the dividends it receives to reduce its own borrowings, particularly those arising from financing the CHO offer.

As an illustration, we estimated that if CHO were to borrow an amount of US$75 million, secured on its fixed assets of US$196.6 million (taking into account revaluation of its vessels), it would be able declare a special dividend of almost US$125.0 million or S$0.24 per share, out of which US$108.4 million would go to FEG for it to repay its entire projected acquisition loan as well as associated costs.  Even with the special dividend payment, CHO would still be able to retain approximately US$19.5 million in cash as working capital. This would however lead to a cash leakage of US$16.6 million to minority shareholders of CHO.

Option 2: Inject FEG’s marine division into CHO

FEG’s marine division's operates a fleet of 22 offshore support vessels ("OSVs"), including accommodation work barges and multi-functional support vessels, that mainly service customers in the production phase of O&G projects. It has traditionally been a major contributor to FEG in terms of revenue and profit. See charts below:
Picture
Figure 5: Marine division is a major contributor to FEG's revenue and operating profits

The division is also FEG's most capital intensive and contributes the majority of the fixed assets in the group:
Picture
Figure 6: Marine division contributes the bulk of FEG's fixed assets.

We thus see scope for the division to benefit from a separate listing which would give it ready access to capital markets. In this aspect, FEG can take advantage of CHO's existing listing by injecting its marine assets into CHO. The consideration can be satisfied partly by cash and shares so as to maintain CHO's mandatory free float while freeing up capital at FEG to reduce its borrowings and to invest in other segments of its core businesses.

We note though that this proposal would be subject to higher execution risks: CHO minorities would have to approve the transaction given that it is an interested persons transaction and FEG would not be eligible to vote. 

Option 3: Privatise CHO by buying over remaining stake held by CHO minorities, possibly via a share swap

As opposed to Option 2, FEG management may feel that there is no need for FEG and CHO to both maintain their listing statuses. Indeed, having two listed entities would lead to additional unnecessary compliance costs, especially when FEG already controls 86.7% of the total outstanding shares of CHO. While CHO's existing free float is only 13.3%, buying out the remaining minorities may cost at least US$38 million even if FEG were to stick to the same terms of S$0.55 cash for each CHO share as per the recently concluded offer. With the estimated gross gearing levels of FEG already at 1.10, any additional borrowings used to fund this would not be ideal.

Hence, we think that it may make more sense for FEG to propose a full or partial share swap instead, effectively paying for the CHO shares held by minorities with new FEG shares. As an illustration, if we were to effect the share swap based on the current FEG price of S$0.27 per share and an CHO offer price of S$0.55 per share, Tan Pong Tyea would still be able to retain his controlling stake at above 50%. 
Picture
Figure 7: Tan PT would still retain majority control even with a full share swap to acquire CHO's remaining shares.

Other variants to the share swap option include those based on NAV, which could cost less for FEG as it is currently trading below its NAV of 33 US cts as at 31 December 2014.

A follow up privatisation offer though may need to be sufficiently more attractive that the previous offer to entice the remaining minorities to accept. This is, however, unlikely to take place within 6 months after the CHO offer closed on 27 February 2015 as the Singapore takeover code forbids a second offer to be made within this period on terms better than the preceding offer.  

Alternatively, FEG may acquire more CHO shares in the open market before it makes the follow up offer to acquire the remaining shares.

Other key developments to note

On 11 October 2013, CHO announced that it had commenced legal proceedings  in London against PDV Marina S.A. and Astilleros De Venezuela C.A. to recover outstanding charterhire amounting to approximately US$56 million. The  trial is set for 20 April 2015. As CHO had previously written down US$44.0 million worth of related receivables in FY2013, a positive outcome from the trial would provide a boost to both FEG and CHO's financial positions and share prices.

Recommendations

We think the successful takeover of CHO by FEG will be positive to both CHO and FEG in the long run in view of the potential operational synergies. FEG's share price, despite trading at just 5.2 times historical adjusted earnings, may continue to be depressed due to the current challenging operating environment in oil and gas. FEG's gearing could also potentially be a drag on earnings in an environment of rising interest rates.

As for CHO, any potential capital optimisation exercises by FEG to reduce its borrowings may lead to short or medium term price catalysts in the form of a special dividend or a further privatisation attempt by FEG. Both CHO and FEG could also benefit from a positive outcome in the impending trial taking place on 20 April 2015. We are positive on FEG's long-term prospects particularly if it manages to successfully integrate CHO's operations into its own but would prefer an exposure to CHO in view of both long term and short term potential upside.

Key Risks

Further deterioration in the O&G sector will negatively impact both CHO and FEG. FEG will be the more vulnerable of the two with the 5 jack-ups owned by its JVs set to be delivered over the next 1-1.5 years. With total debts likely to have hit US$347.6 million, FEG is also susceptible to rising interest rates.
Investors and CHO shareholders may also not be able to trade CHO shares freely with its free float currently at only 13.3%.

[i] The amount of vessels and leasehold properties pledged amounted to U$195.6 million and US$19.6 million respectively as at 31 March 2014. Given that the total value of property, plant and equipment plus joint ventures, under which it held some vessels, was about US$250.1 million, this means that most of its fixed assets had already been pledged for borrowing purposes.
[ii] Assumed LTV ratio of 70% is based on estimated total credit facilities granted for acquiring all CHO shares. LTV ratio calculated based on actual drawdown of the facilities will be lower. 

1 Comment

Chuan Hup Holdings Ltd- Deep Value Emerging

16/2/2015

 
Chuan Hup Logo
Chuan Hup statistics
The intriguing but short shareholders' tussle over CH Offshore Ltd ("CHO") has put the spotlight squarely on Chuan Hup, an undervalued gem long known to value investors but yet attracts little to no analyst coverage. Following its decision to dispose of its entire 24.67% stake in CHO, Chuan Hup stands to reap a windfall of $95.7 million. Its share price has since reacted by adding 11% to close at $0.305 per share on 13 February 2015. With an extremely robust cash-rich balance sheet, key investment holdings in strong cashflow generating entities, prospects of a good dividend payout, we rate Chuan Hup as a good long term buy for investors with a possible short term price catalyst.

Background

Brief takeover tussle

On 9 February 2015, Falcon Energy Group Ltd ("FEG") announced that it will increase its offer for CH Offshore shares to $0.55 per share from $0.495 previously. On the same day, Chuan Hup announced its intention to accept the revised offer after initially rejecting the original and snapping up 0.91% worth of shares in the open market in an apparent attempt to put pressure on FEG. This is close to the 1% it can acquire in any 6 month-period before triggering its own takeover as Chuan Hup and Peh Kwee Chim, its controlling shareholder own more than 30.6% of CHO's total shares (although it was disclosed in the CHO offeree circular dated 8 January 2015 that including associates, this figure is around 35.1%) prior to the FEG offer.

This effectively ended a shareholders' deadlock that has been in existence ever since FEG acquired its original 29.1% stake in April 2010 from Bursa-listed Scomi Marine Berhad (n.k.a. Scomi Energy Services Berhad), who in turn had acquired the same stake from Chuan Hup back in 2005.

Potential Win-Win-Win

FEG finally managed to wrest control of CHO at a reasonable price after initially spending $143.5 million in 2010 to acquire its 29.1% stake at a much higher price of $0.70 per CHO share. The revised offer of $0.55 is at a slight discount to the estimated revalued NTA per share of $0.57 per CHO share (source: CHO offeree circular) as at 30 September 2014. CHO also has an ungeared balance sheet with net cash per share of around $0.13 per share potentially giving FEG flexibility to recapitalise the company and reduce its own upfront cost of funding the acquisition. We expect synergies to be derived from combining FEG's fleet of mainly accommodation barges and rigs with CHO's complementary fleet of AHTS vessels going forward. 

Shareholders of CHO get to exit their investments at a price that has not been reached for more than 4 years even as the share prices of almost all other oil and gas counters have plummeted. (see CHO historical price chart below) Even shareholders who chose not to accept the offer and remain as CHO shareholders can potentially benefit from the operational synergies as described above.
CH offshore share price chart
Figure 1: CHO last traded at $0.55 in 2010

Finally, Chuan Hup gets to cash in on its CHO stake for a tidy sum of $95.7 million and turn its focus on other investments amidst a weak current operating environment for CHO's oil and gas services business. Shareholders of Chuan Hup could even be in line for a special bonanza if the board of directors decides to emulate its feat of distributing a bumper 44 cts per share special dividend in FY2006 representing almost 100% of its $485.6 million cash proceeds from the disposal of its marine logistics business along with 49.1% stake in PT Rig Tenders Indonesia and the 29.1% stake of CHO shares to Scomi Marine. For comparison purposes, the $95.7 million proceeds should translate to about 10.2 cts per share if distributed fully. 

Chuan Hup and its treasure trove

Chuan Hup core businesses
Since its establishment in 1970 as a tug and service provider for PSA Corporation in Singapore, Chuan Hup has quietly grown under the guidance of co-founder Peh Kwee Chim into a diversified group with core interests in oil and gas services, property development and electronics manufacturing services. Post CHO disposal, the company is likely to focus its attention on the latter two while seeking out new investments.

PCI Ltd

Chuan Hup's electronics manufacturing business is carried out under SGX Mainboard-listed PCI Ltd (www.pciltd.com), which it successfully made its subsidiary (76.7% owned) following a mandatory conditional offer in May 2011. Despite operating in a tough and competitive industry, PCI has delivered at least 10 consecutive years of profits and has an enviable and uninterrupted track record of paying consistent dividends of at least 3 cts per share for most years in the same period with a total of 10 cts paid for the financial year ending 30 June 2014. 
Chuan Hup dividend payment history
Figure 2: PCI has a strong uninterrupted track record of dividend payments with at least 3cts per share in 7 out of the past 10 financial years despite operating in a competitive industry (Source: company, shareinvestor) 
PCI Ltd cashflow
Figure 3: PCI has maintained positive operating cashflows and high levels of cash for at least the last 7 financial years (Source: company)

PCI also has a very strong balance sheet with no borrowings and cash holdings of $52.9 million (US$39.1 million) as at 31 December 2014 after adjusting for considerations to be received and paid pursuant to its proposed disposal of the Jalan Ahmad Ibrahim property (announced 13 Feb 15) and acquisition of the Pioneer Road North property (2 Jan 15). This forms approximately 62% of its market capitalisation of $85.6 million based on the closing price of $0.43 per share, giving it an enterprise value of just $32.7 million and a very undemanding FY2014 EV/Ebitda of just 3.1 times.  At $0.43 per share, Chuan Hup's stake is worth $65.7 million.

Finbar Group Ltd

Chuan Hup’s other major investment in a listed company is in Perth-based Australian property developer and ASX-listed Finbar Group Limited (www.finbar.com.au), in which it holds a long term strategic stake of 17.5%. It should be noted that even though the stake is less than 20% and Chuan Hup could not equity account for Finbar's share of profits, it is actually the largest single shareholder in the property company.  

Finbar is a leading property developer in Western Australia, particularly Perth, and has a long established track record of 2 decades, having completed 58 projects worth A$2.8 billion.  It also has an impressive streak of having generated 8 consecutive years of net profit growth with an even longer run of increased dividend payments since FY2003. 
NPAT, Finbar group annual report
Finbar Group, dividend payment history
Figure 4: Finbar has an impressive track record of generating profits and increased dividends.

Despite being a property developer and consistently paying dividends, the company has also managed to keep its net gearing to a low level of just 7.3% as at 30 June 2014. As at the closing price of A$1.345 per share, Finbar has an attractive dividend yield of 7.4%.  Chuan Hup's stake is worth $56.3 million (A$53.6 million)

Property development in Australia


Chuan Hup currently has 2 property joint ventures with Finbar ("Australian JVs"):
  • Symphony City, a 3-phase residential development to be built on the former Australian Broadcasting Corporation site located at 187 Adelaide Terrace, East Perth, Western Australia. The site was acquired by Chuan Hup in 2008 for A$37.6 million. Of the 3 phases (Adagio, Toccata, Concerto), Adagio has been fully sold, completed and earnings mostly recognised in FY2013. Earnings from Toccata (to be completed in FY2015) and Concerto (FY2017) will be recognised in the subsequent years.
  • Unison, a residential development to be built on a plot of freehold land in Maylands Perth acquired by Chuan Hup in 2013 for A$16.7 million. The land acquisition was funded by sales proceeds from Adagio. The development consists of 347 residential apartments and 4 commercial lots to be launched over 2 phases, Unison on Tenth and Unison on Kennedy, to be completed in FY2016 and FY2017 respectively.

Under both JV agreements, Chuan Hup contributed the land and Finbar contributed the working capital necessary for the development. There should thus be no further foreseeable capital requirements for Chuan Hup going forward for these JVs. Profits from both developments will only be recognised upon physical completion and settlement of sold apartments.

Based on information from Finbar's website to date, Toccata has sold 68% of its units while Concerto's sales is at 46% (104 of 226 units) since marketing commenced in March and August 2014 respectively. Unison on Tenth has sold 32% of its units (54 of 167) since marketing commenced in early FY2015. 

With a book value carried at cost of just US$33.5 million ($45.4 million) for both Symphony City and Unison, Finbar’s impressive track record, we expect positive contributions from these two projects over the next 3 years despite the current challenging conditions in the Western Australia real estate market. For illustration, Chuan Hup registered a profit before tax of US$19.4 million over FY2013 and FY2014 for its property development segment primarily due to completion of Adagio.
Finbar projects
Figure 5: Toccata, Concerto, Unison on Tenth. Sales figures as at September 2014 based on Finbar’s annual report although Finbar's website lists more updated figures. Source: Finbar

Other significant assets:
  • A 32.5% stake in Security Land Corporation (SLC), a property developer in Philippines. SLC is majority controlled by Security Bank Corporation of Philippines, a US$ 2.1 billion company listed on the Philippines Stock Exchange, and has a joint venture agreement with Robinsons Land Corporation to construct a high-end condominium within the Makati financial district in Manila. Tower 1 and Tower 2 of the project, named Signa Designer Residences, were 84% and 44% sold respectively as at September 2014. SLC also owns an adjacent office block through which it derives regular rental income.
  • Office units in GB building in Shenton Way, Singapore, acquired in November 2014 for $31.7 million as long term investments.

Valuation

Using sum-of the parts (SOTP) method, we derive at a conservative value for Chuan Hup of $0.432 per share. Our valuation pegs PCI and Finbar to their respective market valuations and the remaining assets conservatively at book value, which in the case of the Australian JVs is at cost. The valuation is supported by approximately $0.226 net cash per share, taking into account Chuan Hup's share of the PCI's cash hoard. This is, in our view, reasonable as Chuan Hup effectively controls the use of cash at PCI.
Chuan hup proforma balance sheet
Figure 6: SOTP computation

Recommendation

We believe there is deep value embedded in Chuan Hup which should appeal to long term value investors. In addition, Chuan Hup's shareholders could also benefit in the short term should sales proceeds from the disposal of CHO shares be paid out as special dividends in a repeat of the disposal to Scomi Marine in 2005. The shares are currently trading at a 29.4% discount to its intrinsic conservative SOTP value of $0.432 per share with good downside protection provided by its adjusted net cash per share of $0.226 as well as a decent dividend yield of 3.3%. We are buyers at this price. 

Key Risks

The strengthening US dollar against both the Australian and Singapore dollar has resulted in Chuan Hup being hit by significant foreign currency related losses in recent quarters. We think that this could be a key concern going forward. The weakening Western Australian real estate market could also pose challenges to both its Australian JVs, although this is mitigated by the Australian JVs being carried on its books at cost.  

(All preceding amounts in SGD unless stated, USD:SGD X-rate of 1.3550 and AUD:SGD X-rate of 1.0520 assumed)

Memstar Technology Ltd (Update)- Extended deadline highlights risk

10/2/2015

 
Events since our first report (link)

Trading in Memstar Technology Ltd was temporarily halted from 2 to 5 February 2015 in what must have been a nerve-wracking few days for its shareholders. 

Recall that in our previous report, we had highlighted risks relating to completion of the RTO, which is subject to a host of conditions. Two of the key conditions were supposed to have been met by 31 January 2015:  
  1. the Target successfully completing Tranche 2 Fundraising of US$15 million; and  
  2. the Target entering into an off-Take agreement with Petro China and/or CNPC for the purchase of the Target’s coal bed methane. 
The company subsequently announced on 5 February 2015 that it had entered into a supplemental agreement to extend the deadline for fulfilling the 2 conditions above to 28 February 2015. The shares have been trading within a range of $0.018-0.020 since our first report and last closed at $0.019 on 9 February 2015. See below:
memstar share price chart
Our Views

The extension of deadline highlights the non-completion risks shareholders face even as the clock is ticking on Memstar's own 11 April 2015 deadline to fulfill SGX continuing listing requirements. While SGX could possibly grant an extension for the RTO to complete, we reiterate that should it be aborted, the prospects of shareholders being able to extract any meaningful value out of their shares would be quite dim.  Even if the RTO is successfully completed, the implied market valuation of Longmen (representing the combined group) post completion at US$526 million looks rich compared to its much bigger competitor, Green Dragon. 

Updated comparison table:
Memstar Longmen, Green Dragon
Recommendations

At $0.019, the share price seems to have fully priced in certainty of deal completion. We still do not think this is justified given the multiple risks factors that might affect completion. Downside risks far outweigh any upside potential, if any at all. Investors should steer clear at this price. 

Memstar Technology Ltd- Share price surge unjustified

21/1/2015

 
Memstar Technology Ltd has surged 33.3% in the last one month since announcing a reverse takeover ("RTO") on 20 December 2014 of Longmen Group Ltd ("Target"), a private developer of coal bed methane ("CBM") resources in Shaanxi Province, China. While the announcement may be a welcome boost to shareholders of Memstar given that it has only until 11 April 2015 to meet requirements to stay listed or be possibly forced into a delisting by SGX, we think that the surge is more speculative in nature and not backed by fundamentals. We see no reason for the shares to trade at the current price of S$0.020 pending further details on the acquisition.

Background

Memstar announced that it had entered into an agreement to acquire Longmen for US$420 million (S$546 million[1]) by issuing 33.81 billion consideration shares at S$0.01615 per share, a 7.7% premium to its closing price of S$0.015 on 28 November 2014, the last trading day before trading was temporarily halted pending the RTO announcement.

Longmen owns participating interests in 2 CBM concessions (collectively "Longmen Concessions"):
  1. A 60% participating interest through a production sharing contract (PSC) entered into with China National Petroleum Corporation (CNPC) to explore, develop, produce and sell CBM gas covering 2 blocks of area in Hancheng, Shaanxi effective for 30 years from March 2007.
  2. An 80% participating interest in a gas extraction agreement (GEA) with Hancheng Coal Mine Bureau for CBM extraction in 3 mines in Hancheng effective for 20 years from July 2008. Coal mining is currently ongoing in these mines with concurrent CBM production.

The Longmen concessions contain net 2P (Proved and Probable) CBM reserves of 190 billion cubic feet, with a present value of approximately US$917 million calculated using the standard 10% discount rate (otherwise known as a PV10 value, a common nomenclature for Oil and Gas reserves).

The Target is 50.43% owned by LESS Longmen Co Ltd, a fund of funds, with the remaining shareholders a collection of private equity funds and current and prior management.

The Target has been loss making for FY2011-13 and is in a net liability position of US$43.7 million largely due to existing liability and derivative tied to redeemable preference shares in issue of US$99.1 million in total.
Longment profit and loss (P&L)
The RTO is subject to, amongst other conditions, completion of 3 tranches of fund raising exercises at various stages:
  • Tranche 1: Initial US$5 million refundable deposit, to be raised by Memstar and paid to Target, which carries a option to convert into Target shares at valuation of US$210 million. (Tranche 1 has been completed on 6 January 2015)
  • Tranche 2: US$15 million to be raised by Target on or before 31 January 2015
  • Tranche 3: US$60 million to be raised by Memstar on or before completion of RTO

Our Views

At the current price of S$0.020 per share, Memstar has a market capitalisation of  S$61.1 million taking into account new shares that were issued pursuant to the Tranche 1 placement. This is backed by an NTA of just S$9.2 million comprising the S$6.6 million refundable deposit paid to Target with the remaining in cash.

Completion of the transaction is far from certain and subject to a host of conditions including further fund raising exercises to be completed and Target being able to successfully procure all exploration rights to be renewed for maximum possible term.

As we have noted before, RTOs historically do not enjoy high completion rates (see here). This is also the second attempt by Longmen to list on SGX after having previously failed to reach agreement on terms following a non-binding MOU signed with PSL Holdings Ltd back in 14 May 2014. The exclusivity for the MOU lapsed on 13 October 2014 and a similar refundable deposit of US$5 million has since been returned to PSL.

Memstar has been classified as a cash company under SGX listing rules since 11 April 2014 and has just until 11 April 2015 to meet SGX requirements to continue to be listed. Should the transaction be aborted for whatever reasons, there is likely to be insufficient time for Memstar to seek another target to maintain its listing status and shareholders will be left with a company that has little assets other than cash of just S$0.003 per share vs the current price of S$0.020!

Further, we note that the main reason for the current optimism could lie in the Target's reported 2P reserves of 190 billion cubic feet with a PV10 value of US$917 million. Investors should, however, put this into perspective against the following:
  • The PV10 value was computed based on a report dated 31 December 2013. Although CBM prices usually trade at a slight premium to conventional natural gas prices, there is nonetheless a strong correlation between the two. As natural gas prices has softened considerably in the last one year[2],[3], there is a risk that the reported PV10 value using CBM price assumptions then may be on the high side. That said, possible mitigation to this risk could come from increased Chinese government subsidy. 
  • The Longmen Concessions are largely still at the pre-production stage. Although the GEA covers an area which is currently in production, it is not a significant revenue contributor as yet as witnessed by Longmen Group's paltry revenues of US$0.5 million for FY13 and just US$2.6 million on average for the last 3 FYs.
  • Under the PSC, there are two main blocks: a north block covering 234.3 sq km, which is still in exploration stage and largely inactive, and a south block covering 171.8 sq km, for which exploration has been completed and full-scale commercial production is planned for early 2016. There is likely to be significant capital expenditures required in order to bring both blocks under the PSC to full commercial production and contribute to the bottom line.
  • Longmen's much larger competitor, LSE-listed Green Dragon Gas (Bloomberg code GDG:LN) has, as at November 2014, 2P reserves of 380 billion cubic feet with a PV10 of US$3.1 billion and 6 PSCs covering 7,566 sq km. Green Dragon currently has a market capitalisation of US$852 million (GBP 562 million) and Enterprise Value of US$872 million. 
  • Comparing the two, Longmen’s valuation appears excessively rich:
Longmen vs Green Dragon
Recommendation

While the RTO is a potential lifeline for Memstar shareholders who might otherwise be faced with the unwelcome prospect of a forced delisting by SGX come 11 April 2015, investors should be cognisant of the significant downside risks posed in the event the deal is aborted. Even if the RTO is completed successfully, the current price of S$0.020 per share is unjustified based on currently available information and on valuation grounds. We see no reason for it to be trading at such lofty levels.

[1] Based on exchange rate of US$1 to S$1.30 provided in announcement
[2] Henry Hub spot prices have declined from US$4.71/mmbtu in January 2014 to US$3.48/mmbtu in December 2014
[3] Reuters, 9 December 2014: Price of LNG lowest in 4 years. LNG prices in Asia down nearly 50% since January 2014
Forward>>
    Like our Facebook page for the latest updates:
    Follow @StockResearchA
    RSS Feed Widget

    Author

    StockResearchAsia Team

    Archives

    June 2020
    November 2019
    July 2019
    June 2019
    March 2019
    January 2019
    September 2018
    June 2018
    March 2018
    February 2018
    January 2018
    December 2017
    November 2017
    September 2017
    July 2017
    June 2017
    February 2017
    September 2016
    May 2016
    March 2016
    January 2016
    December 2015
    November 2015
    September 2015
    August 2015
    June 2015
    May 2015
    April 2015
    March 2015
    February 2015
    January 2015

    Categories

    All
    Abric Berhad
    Asia Enterprises Holding Ltd
    Bukit Sembawang Estates Ltd
    Bursa
    Ch Offshore Ltd
    Chuan Hup Holdings Ltd
    Corporate Action
    E2-Capital Holdings Ltd
    Falcon Energy Group Ltd
    Finbar Group Limited
    Healthcare Sector
    Health Management International Ltd
    HG Metal Manufacturing Ltd
    Hkt
    Hupsteel Ltd
    Ipc Corporation Ltd
    Ipos
    Irving Kahn
    Jaya Holdings Ltd
    Kejuruteraan Samudra Timur Berhad
    Keppel Corporation
    Macquarie International Infrastructure Fund
    Memstar Technology Ltd
    OKP Holdings Ltd
    Pacific Century Regional Developments Ltd
    Pccw Ltd
    Pci Ltd
    Pcpd Ltd
    Privatisation
    Raffles Medical Group Ltd
    Rtos
    Scomi Energy Berhad
    Sembcorp Industries
    Sembcorp Marine
    Sgx
    Singapore Airlines Ltd
    Singapore O&G Ltd
    Special Situations
    Sysma Holdings
    Takeover Offer
    Talkmed Group Ltd
    Tiger Airways Holdings Ltd
    TIH Ltd
    Tsh Corporation Ltd
    Value Investor
    Year End Review
    Yongnam Holdings Ltd

    RSS Feed

IMPORTANT NOTICE
We put money where our mouth is. As such, we do take positions in the securities mentioned on this website or any securities related thereto and may from time to time add or dispose of or may be materially interested in any such securities. The research materials provided on this site is for information only. Investors should seek the assistance of a qualified and licensed financial advisor in making their investment decisions. The research reports/notes are compiled based on information, which we believe to be reliable. Any opinions expressed reflect our judgment at as at the date of the reports or notes and are subject to change without notice. It does not have regards to the specific investment objectives, financial situation and the particular needs of any specific person who may receive or access this research material. Our recommendations are not to be construed as an offer, or solicitation of an offer to sell or buy securities referred herein. The use of this material does not absolve you of your responsibility for your own investment decisions. We accept no liability for any direct or indirect loss arising from the use of this research material. This research material may not be reproduced, distributed or published for any purpose by anyone without our specific prior consent.