
 |  |
In our report on Chuan Hup, we suggested that Falcon Energy Group Ltd’s (“FEG”) successful takeover offer for CH Offshore Ltd ("CHO"), which resulted in CHO becoming its 86.7% owned subsidiary, could be a win-win-win situation for all three companies involved. In this report, we take a closer look at FEG and assess its options with respect to its newly acquired CHO stake.
Introduction to FEG
History
FEG has come a long way ever since it morphed from the then Sembawang Music Holdings Ltd ("SMH"), a small music retail business listed on SGX SESDAQ (n.k.a Catalist), via a 2-stage reverse takeover process into an established Oil and Gas ("O&G") services provider.
The transformation began in May 2006, when Tan Pong Tyea, the current majority shareholder of FEG and a long-time veteran of the oil and gas industry, acquired a 55.0% stake in SMH, triggering a mandatory takeover offer and gaining control of the listed entity. SMH subsequently became known as Falcon Energy Group Ltd. With Tan at the helm, FEG began its initial foray into the new core business of Marine and Oil and Gas services.
The new business gained steam when Tan injected his privately held Oilfield Services Company Limited, a well-established company started in 1983, into FEG. The consideration of S$229 million was paid entirely in newly issued FEG shares, further tightening Tan's grip on FEG. The legacy music business was also disposed of along the way to SMH's former controlling shareholder.
This series of moves laid the foundation for what FEG is today.
Core Businesses
FEG currently has 5 main business divisions catering to customers in different stages of the exploration and production phase in the upstream O&G sector. The services offered under each division can either be offered individually or integrated and customised to cater to each customer’s specific requirements. The 5 divisions are listed below:
- Marine Division: Owns and operates a fleet of 22 offshore support vessels ("OSVs") that mainly service customers in the production phase of O&G projects. These include one of the largest fleet of Accommodation Work Barges (13) in the region alongside 3 Multi-functional Support Vessels, 1 Anchor Handling Tug and 5 other OSVs. The Marine division provides a wide range of platform supply and engineering services.
- Oilfield Services Division: Provides services such as agencies, logistics, procurement and other general support activities to customers like O&G majors, national oil companies (NOCs), contractors and shipyards globally. This division also provides engineering and consultancy services for the construction of oil rigs and OSVs.
- Oilfield Projects Division: Provides O&G project related services of varying nature such as building and leasing of specialised seismic vessels and marketing agency for oil companies, ranging from small facilities to multi-million dollar heavy oil facilities.
- Drilling Services Division: Relatively new division started in 2011 to provide drilling and related services to the O&G majors, NOCs and O&G contractors. Through this division, the group has been building up a modern fleet of high specification jack-up rigs via joint ventures (“JVs”) with its strategic partners. The JVs currently have a total of 5 rigs on order: 4 GustoMSC CJ50 and a Keppel FELS Super B Class jack-up. All 5 rigs were ordered in 2013 and are expected to be delivered between mid-2015 to mid-2016. FEG has an effective ownership stake of 25% in these rigs. The Group previously also held stakes in 2 more GustoMSC CJ46 rigs ordered in 2011 but both were sold to China Oilfield Services Limited before they were delivered, netting FEG substantial gains for FY2014.
- Resources Division: Set up in 2010 to create another energy-related stream of revenue for the group. FEG has acquired the commercial rights to three coal-mining concessions in East Kalimantan, Indonesia. According to FEG's annual report, production of coal was expected to commence in 2014 although we have not seen evidence of this happening as yet: in its latest Profit & Loss statement for the 9 months ending 31 December 2014, 100% of FEG's revenue came from Marine, Oilfield Services and Oilfield Projects divisions. FEG remains on the lookout for further coal acquisitions.
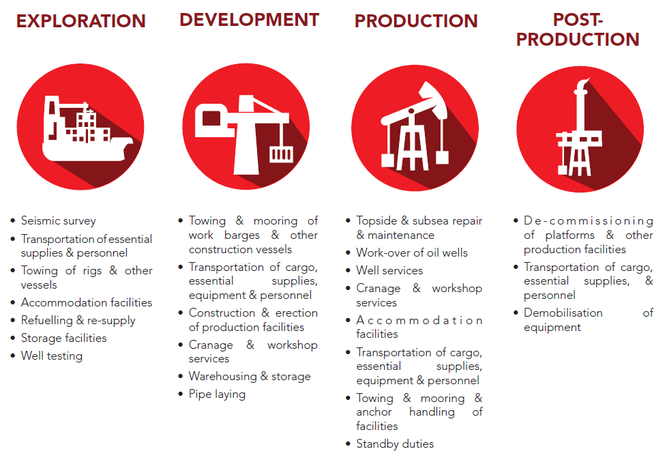
Figure 1: FEG's services cover the full spectrum of exploration and production phase in the upstream O&G sector. Source: FEG
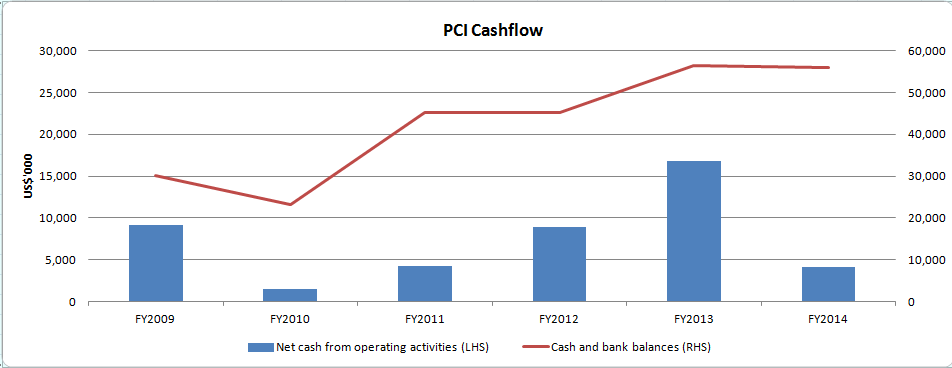
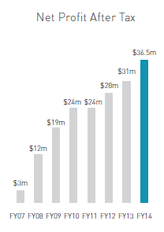
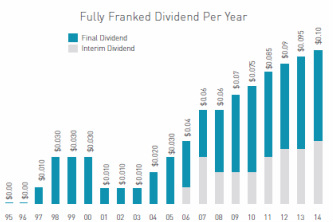
Recent Financial performance
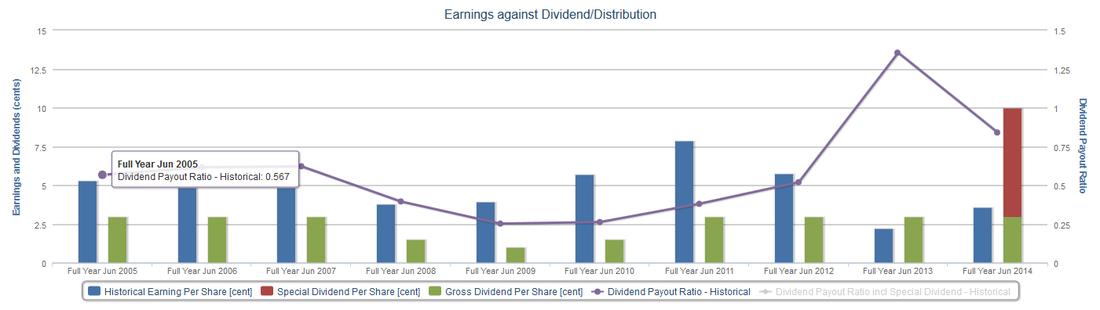
FEG has in recent years managed to successfully execute its multi-prong expansion plans with both top and bottom line growing more than 4 times since the downturn in FY2010 to US$350.8 million and US$60.8 million respectively in FY2014. We note though, that revenue and earnings for FY2014 were boosted by the disposal of the two GustoMSC CJ46 rigs, without which they would still have been approximately US$222.4 million and US$30.5 million respectively. Although FEG does not appear to have a consistent dividend policy, they have paid dividends of between 0.5 to 1.5 Singapore cents in 4 out of the last 5 years.
Recent Financial performance
FEG has in recent years managed to successfully execute its multi-prong expansion plans with both top and bottom line growing more than 4 times since the downturn in FY2010 to US$350.8 million and US$60.8 million respectively in FY2014. We note though, that revenue and earnings for FY2014 were boosted by the disposal of the two GustoMSC CJ46 rigs, without which they would still have been approximately US$222.4 million and US$30.5 million respectively. Although FEG does not appear to have a consistent dividend policy, they have paid dividends of between 0.5 to 1.5 Singapore cents in 4 out of the last 5 years.
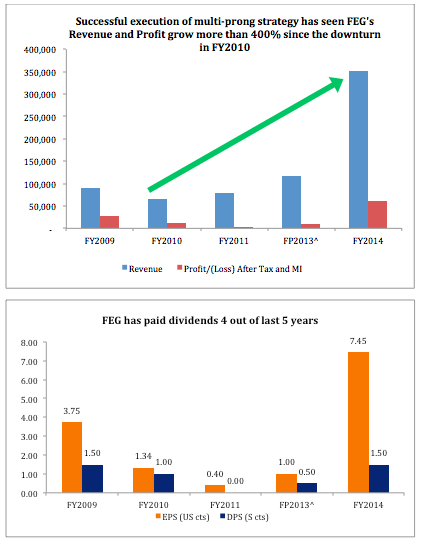
^FEG changed its financial year from December to March resulting in a 15-month financial period straddling FY2012 and FY2013. Profit After Tax and MI adjusted for FEG’s share of a one-off writedown on CHO’s receivables of US$43.95 million during FP2013 of which the outcome is still pending.
Figure 2: FEG's performance in recent years has been on the uptrend. Source: FEG
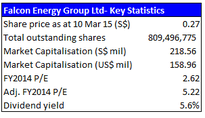
At the current share price of S$0.27 and implied market capitalisation of S$218.6 million, FEG is trading at a valuation of 5.2 times FY2014 earnings adjusted for gains from disposal of the two rigs, with an above average dividend yield of about 5.6%. As with all other oil and gas services companies, we expect operational environment going forward to remain challenging although the effect of lower oil prices have yet to manifest itself in the latest reported financial period of 9M2015 ending 31 December 2014 with profit after tax and minority interests already at US$34.2 million.
CHO shareholders' deadlock finally broken- expect more synergies
FEG had not been able to exert any meaningful control over CHO ever since it acquired its initial 29.1% stake from Scomi Marine Berhad (n.k.a Scomi Energy Berhad) back in 2010, as witnessed by it not having any representatives in a key executive role on board of CHO- FEG Chairman Tan and CFO Gan Wah Kwang are both non-executive board members. This was largely due to Chuan Hup and its associates controlling a higher 35.1% stake in CHO. Now that Chuan Hup is no longer in the picture, we should start to see more integration between CHO and FEG's operations.
We expect CHO's fleet of 15 AHTS, including seven of the 12,240 bhp variety built in Japan, to complement FEG's fleet of mainly Accommodation Work Barges nicely by significantly expanding the scope of services its marine division provides and increasing its fleet capabilities. For more on the 2 types of OSVs, see Figure 3 below. There should also be increased service cross-selling opportunities going forward with the enlarged clientele base as well as geographical coverage.
Figure 2: FEG's performance in recent years has been on the uptrend. Source: FEG
At the current share price of S$0.27 and implied market capitalisation of S$218.6 million, FEG is trading at a valuation of 5.2 times FY2014 earnings adjusted for gains from disposal of the two rigs, with an above average dividend yield of about 5.6%. As with all other oil and gas services companies, we expect operational environment going forward to remain challenging although the effect of lower oil prices have yet to manifest itself in the latest reported financial period of 9M2015 ending 31 December 2014 with profit after tax and minority interests already at US$34.2 million.
CHO shareholders' deadlock finally broken- expect more synergies
FEG had not been able to exert any meaningful control over CHO ever since it acquired its initial 29.1% stake from Scomi Marine Berhad (n.k.a Scomi Energy Berhad) back in 2010, as witnessed by it not having any representatives in a key executive role on board of CHO- FEG Chairman Tan and CFO Gan Wah Kwang are both non-executive board members. This was largely due to Chuan Hup and its associates controlling a higher 35.1% stake in CHO. Now that Chuan Hup is no longer in the picture, we should start to see more integration between CHO and FEG's operations.
We expect CHO's fleet of 15 AHTS, including seven of the 12,240 bhp variety built in Japan, to complement FEG's fleet of mainly Accommodation Work Barges nicely by significantly expanding the scope of services its marine division provides and increasing its fleet capabilities. For more on the 2 types of OSVs, see Figure 3 below. There should also be increased service cross-selling opportunities going forward with the enlarged clientele base as well as geographical coverage.
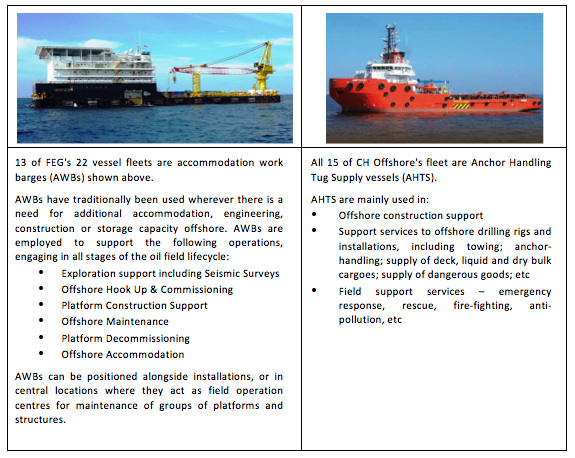
Figure 3: FEG's AWBs vs CHO's AHTS. Source: Intership, FEG, CHO.
FEG's gearing ratio likely to have risen significantly- room to optimise capital structure
As at 31 December 2014, FEG had cash of US$88.9 million vs total debts including notes payable of US$239.4 million, giving it a gross gearing and net gearing of about 0.82 and 0.51 respectively. The debts are mostly secured[i] against its existing vessels and leasehold office properties.
FEG had also previously disclosed its intention to fund the CHO takeover using bank borrowings and internal cash resources. Assuming a Loan to value ("LTV") ratio of 70%[ii], we estimate that an additional US$106.7 million of debts would have been added to date and the gross and net gearing would have ballooned to 1.10 and 0.80 times respectively despite the larger equity base due to consolidation of CHO's accounts. This is on par with its peer companies:
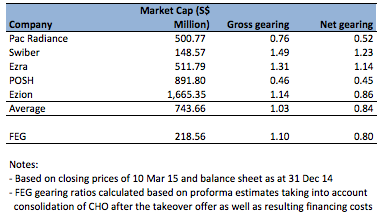
Figure 4: FEG's estimated proforma gearing is in line with its peers.
However, despite the seemingly manageable consolidated gearing, we note that all the debts (estimated at US$347.6 million) are now being carried on FEG's books. On the other hand, a large portion amounting to US$69.5 million of the combined cash balance is carried on CHO's debt-free books.
It is important to make this distinction, as while CHO is now majority controlled by FEG, they are fundamentally two separate listed entities each managed by its own board of directors. Cash carried on CHO's balance sheet for example could not be used to pay FEG debt or service FEG interest unless distributed upwards to FEG via say dividends. Thus, we believe that there is room for FEG to carry out a capital structure optimisation exercise and lower its own gearing, especially with the market expecting an interest rate hike later this year.
Strategic options for FEG
We believe FEG may undertake the options put forth below to optimise its capital structure:
Option 1: Gear up CHO’s balance sheet to repay borrowings at FEG
One possible option is for CHO to take on borrowings against its balance sheet and distribute the loan proceeds as well as excess cash on its books to its shareholders in the form of a special dividend. FEG can then use the dividends it receives to reduce its own borrowings, particularly those arising from financing the CHO offer.
As an illustration, we estimated that if CHO were to borrow an amount of US$75 million, secured on its fixed assets of US$196.6 million (taking into account revaluation of its vessels), it would be able declare a special dividend of almost US$125.0 million or S$0.24 per share, out of which US$108.4 million would go to FEG for it to repay its entire projected acquisition loan as well as associated costs. Even with the special dividend payment, CHO would still be able to retain approximately US$19.5 million in cash as working capital. This would however lead to a cash leakage of US$16.6 million to minority shareholders of CHO.
Option 2: Inject FEG’s marine division into CHO
FEG’s marine division's operates a fleet of 22 offshore support vessels ("OSVs"), including accommodation work barges and multi-functional support vessels, that mainly service customers in the production phase of O&G projects. It has traditionally been a major contributor to FEG in terms of revenue and profit. See charts below:
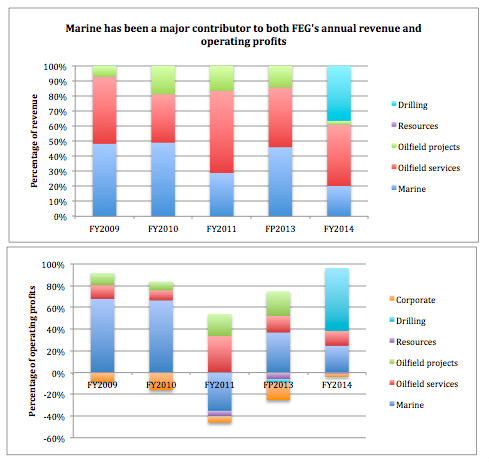
Figure 5: Marine division is a major contributor to FEG's revenue and operating profits
The division is also FEG's most capital intensive and contributes the majority of the fixed assets in the group:
The division is also FEG's most capital intensive and contributes the majority of the fixed assets in the group:
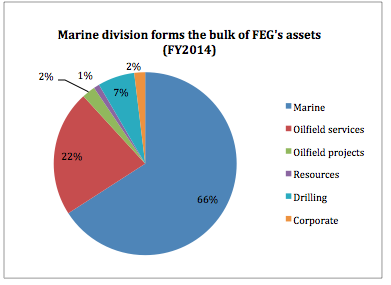
Figure 6: Marine division contributes the bulk of FEG's fixed assets.
We thus see scope for the division to benefit from a separate listing which would give it ready access to capital markets. In this aspect, FEG can take advantage of CHO's existing listing by injecting its marine assets into CHO. The consideration can be satisfied partly by cash and shares so as to maintain CHO's mandatory free float while freeing up capital at FEG to reduce its borrowings and to invest in other segments of its core businesses.
We note though that this proposal would be subject to higher execution risks: CHO minorities would have to approve the transaction given that it is an interested persons transaction and FEG would not be eligible to vote.
Option 3: Privatise CHO by buying over remaining stake held by CHO minorities, possibly via a share swap
As opposed to Option 2, FEG management may feel that there is no need for FEG and CHO to both maintain their listing statuses. Indeed, having two listed entities would lead to additional unnecessary compliance costs, especially when FEG already controls 86.7% of the total outstanding shares of CHO. While CHO's existing free float is only 13.3%, buying out the remaining minorities may cost at least US$38 million even if FEG were to stick to the same terms of S$0.55 cash for each CHO share as per the recently concluded offer. With the estimated gross gearing levels of FEG already at 1.10, any additional borrowings used to fund this would not be ideal.
Hence, we think that it may make more sense for FEG to propose a full or partial share swap instead, effectively paying for the CHO shares held by minorities with new FEG shares. As an illustration, if we were to effect the share swap based on the current FEG price of S$0.27 per share and an CHO offer price of S$0.55 per share, Tan Pong Tyea would still be able to retain his controlling stake at above 50%.
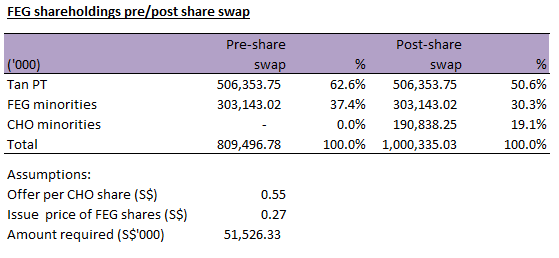
Figure 7: Tan PT would still retain majority control even with a full share swap to acquire CHO's remaining shares.
Other variants to the share swap option include those based on NAV, which could cost less for FEG as it is currently trading below its NAV of 33 US cts as at 31 December 2014.
A follow up privatisation offer though may need to be sufficiently more attractive that the previous offer to entice the remaining minorities to accept. This is, however, unlikely to take place within 6 months after the CHO offer closed on 27 February 2015 as the Singapore takeover code forbids a second offer to be made within this period on terms better than the preceding offer.
Alternatively, FEG may acquire more CHO shares in the open market before it makes the follow up offer to acquire the remaining shares.
Other key developments to note
On 11 October 2013, CHO announced that it had commenced legal proceedings in London against PDV Marina S.A. and Astilleros De Venezuela C.A. to recover outstanding charterhire amounting to approximately US$56 million. The trial is set for 20 April 2015. As CHO had previously written down US$44.0 million worth of related receivables in FY2013, a positive outcome from the trial would provide a boost to both FEG and CHO's financial positions and share prices.
Recommendations
We think the successful takeover of CHO by FEG will be positive to both CHO and FEG in the long run in view of the potential operational synergies. FEG's share price, despite trading at just 5.2 times historical adjusted earnings, may continue to be depressed due to the current challenging operating environment in oil and gas. FEG's gearing could also potentially be a drag on earnings in an environment of rising interest rates.
As for CHO, any potential capital optimisation exercises by FEG to reduce its borrowings may lead to short or medium term price catalysts in the form of a special dividend or a further privatisation attempt by FEG. Both CHO and FEG could also benefit from a positive outcome in the impending trial taking place on 20 April 2015. We are positive on FEG's long-term prospects particularly if it manages to successfully integrate CHO's operations into its own but would prefer an exposure to CHO in view of both long term and short term potential upside.
Key Risks
Further deterioration in the O&G sector will negatively impact both CHO and FEG. FEG will be the more vulnerable of the two with the 5 jack-ups owned by its JVs set to be delivered over the next 1-1.5 years. With total debts likely to have hit US$347.6 million, FEG is also susceptible to rising interest rates.
Investors and CHO shareholders may also not be able to trade CHO shares freely with its free float currently at only 13.3%.
[i] The amount of vessels and leasehold properties pledged amounted to U$195.6 million and US$19.6 million respectively as at 31 March 2014. Given that the total value of property, plant and equipment plus joint ventures, under which it held some vessels, was about US$250.1 million, this means that most of its fixed assets had already been pledged for borrowing purposes.
[ii] Assumed LTV ratio of 70% is based on estimated total credit facilities granted for acquiring all CHO shares. LTV ratio calculated based on actual drawdown of the facilities will be lower.
[ii] Assumed LTV ratio of 70% is based on estimated total credit facilities granted for acquiring all CHO shares. LTV ratio calculated based on actual drawdown of the facilities will be lower.


 RSS Feed