

There has been a buzz surrounding the latest IPOs of small healthcare stocks on the SGX with investors tripping over one another to try to land some coveted but often paltry amount of shares available for public subscription. When you consider the amazing performance of these IPOs, the excitement they generate is understandable.
For instance, Singapore O&G Ltd, a healthcare group operating a small chain of Obstetrics and Gynaecology specialist clinics, surged 154% from its IPO price of S$0.25 per share on its first day of trading on 4 June 2015 after its public tranche was 332 times subscribed. This was one of the best first-day IPO performances on SGX we have seen in recent years, bettered only by the stunning 310% gain recorded by Talkmed Group Ltd on 30 January 2014. Talkmed Group is, as you might have already guessed, another healthcare group but one providing primarily oncology related services.
While one might argue that the reason for the outstanding first day performances of these two IPOs is the strong fundamentals of their respective businesses, we believe that the outperformance can be attributed to two simple, yet key factors: generous dividend guidance and low relative valuation vis-à-vis industry peers.
Talkmed Group
In its listing prospectus, Talkmed provided for a rather generous dividend guidance of 75% of its annual profit after tax which at the time of its listing would have translated to a prospective yield of around 18%! This was largely due to the company pricing its IPO shares at a rock-bottom post money price to earnings (PE) ratio of just 4.1x historical earnings.
Singapore O&G
Similarly, Singapore O&G took a leaf out of Talkmed’s book and opted for the strategy of low relative valuation and generous dividends, guiding a payout of up to 90% of its profit after tax for FY2015. Using its FY2014 earnings as an indication, this would translate to a lower but still attractive prospective dividend yield of 7.3%. While its post money PE ratio of 12.8x appears rich compared to Talkmed's and indeed most other SGX IPOs in recent months, it is still at a huge discount off its Singapore-listed peers in the healthcare sector.
This brings us to the next question, is the healthcare sector in Singapore overpriced as a whole?
Healthcare stocks enjoys supernormal valuation but it is hard to see why
The healthcare sector is traditionally recognised as a defensive sector. Proponents of the Singapore-listed healthcare stocks often point to a number of seemingly compelling factors driving their valuations: ageing population, strong overall reputation for quality, rising consumer awareness, etc.
While all these qualitative factors may indeed contribute greatly towards investors' confidence in the sector, the only question that ultimately matters is if the hard numbers, i.e. earnings, growth, dividends, etc support the valuations.
If we look at the group of SGX-listed healthcare stocks below in Figure 1, which we feel broadly represents the sector, we can see that the average SGX-listed healthcare stock as represented here trades at an astounding trailing-12 months (TTM) PE of 44.5x, 7.5x TTM sales, and 6.0x its book value while paying very little dividend (1.4%).
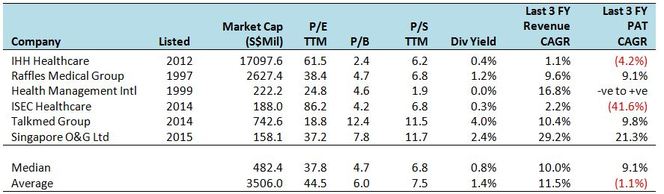
Figure 1: Relative valuation of SGX-listed healthcare stocks as at 19 June 2015 (Source: Morningstar, Company)
For comparative purposes, the corresponding median[i] values of companies on the FTSE ST All-Share Index, which broadly represents about 98% by value of the universe of stocks listed on SGX are about 12.9x PE, 1.1x book and 3.4% dividend yield. By any of these metrics, therefore, there is little doubt that SGX-listed healthcare stocks trade at an unusually high premium to the rest of the market.
To understand if this premium valuation is warranted by strong fundamentals or a result of over exuberant market optimism, we examine a few factors that might offer some clues: historical growth, resilience of the sector’s earnings and trading performance in a downturn.
Positive topline but patchy earnings growth
We note from Figure 1 that the healthcare stocks registered consistent topline growth across the board over the last 3 financial years with an average of 11.5% per annum. This is roughly in line with a Frost & Sullivan report in 2014 estimating healthcare expenditure per capita to grow at 9.7% per year in Singapore and total healthcare expenditure to grow at 10.5% per year in the Asia Pacific region from 2013 to 2018.
Bottom line growth is a lot less uniform with only 4 stocks having generated positive growth, of which Singapore O&G alone registered a double-digit earnings growth at 21.3% although it should be noted that as the smallest player on the list, it had the benefit of a lower base to start off with.
Overall, the growth rates do not compare favourably with the sector's high PE ratios. As legendary investor Peter Lynch noted in his book, One Up on Wall Street, that “The P/E ratio of any company that's fairly priced will equal its growth rate”. If we apply this measure as a rough gauge for value, we can see that none of the healthcare stocks are trading anywhere close to a PE ratio that would suggest that they are under or fairly valued.
Earnings has proven defensive for certain stocks
If growth is insufficient to justify the valuations, how about the supposedly defensive qualities of the healthcare stocks' earnings? To measure how defensive the earnings of these stocks might be, we look back to a period spanning the most recent global financial crisis (GFC), specifically from FY2007 to FY2010. As only two of the six companies on our list, namely Raffles Medical Group ("RMG") and Health Management International ("HMI"), were listed back then, we look each of their performances individually.
From Figure 2 below, we can see that RMG's earnings proved to be rather resilient throughout the financial crisis as both revenue and earnings were generally on the uptrend with just a minor dip in earnings in FY2008. It also maintained a healthy net profit margin of above 15% throughout even though there was an initial drop from FY2007 to FY2008.
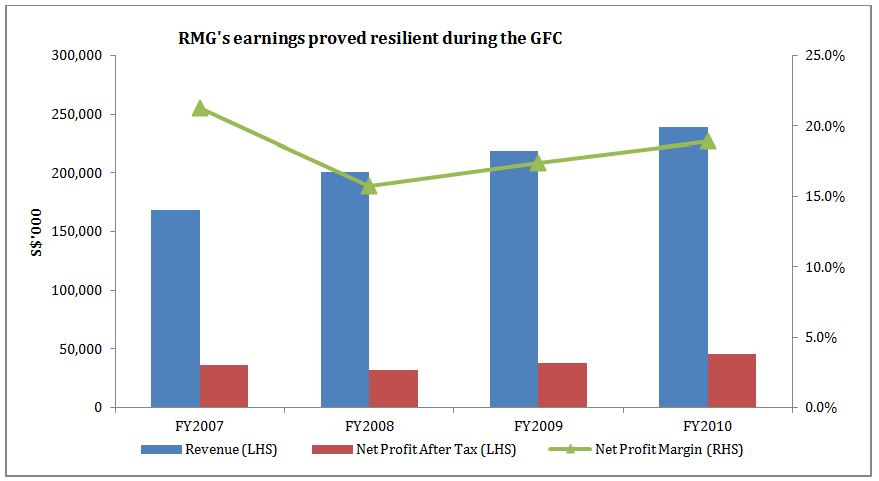
Figure 2: RMG's revenue and net earnings after tax for FY2007 to FY2010
The same cannot be said for HMI as its earnings took a dive during the GFC. We note that FY2007 earnings were boosted by one-off net gains of about S$5 million. This was further exacerbated by start-up costs booked in FY2009 attributable to its then newly established Regency Specialist Hospital in Johor, causing the earnings downtrend look more pronounced than it actually was.
However, even after taking these adjustments into account, HMI's earnings growth trend during this period would still have been slightly negative despite it registering consistent topline growth.
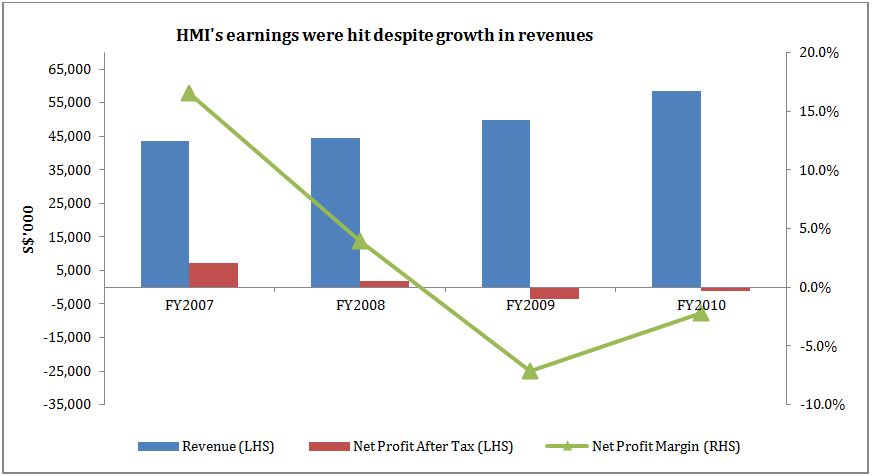
Figure 3: HMI's revenue and net earnings after tax for FY2007 to FY2010
The operational performances of RMG and HMI during the GFC suggest that healthcare earnings could well be defensive for a well managed company like RMG but it is not a given for others within the sector like HMI. The more recently listed healthcare players have yet to be tested in this regard.
Trading performance may not hold up in a downturn
We next look at how look at how the companies' share prices performed during the period spanning the GFC. Again, only RMG and HMI's trading data are available for this purpose.
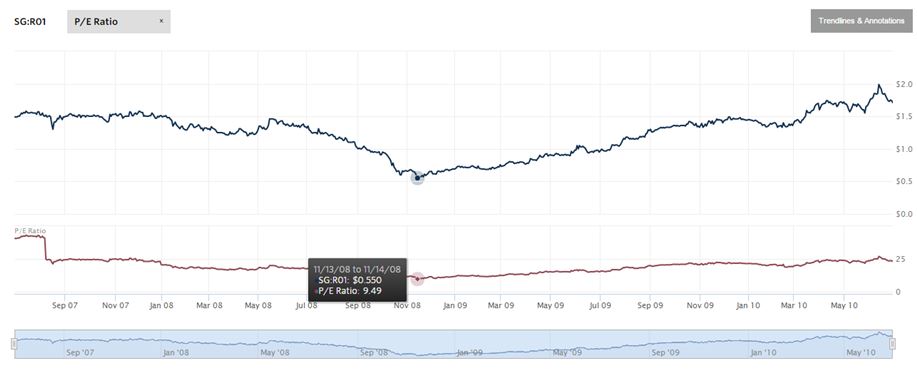
Figure 4a: Absolute share price of RMG during the period of 1 July 2007 to 30 June 2010
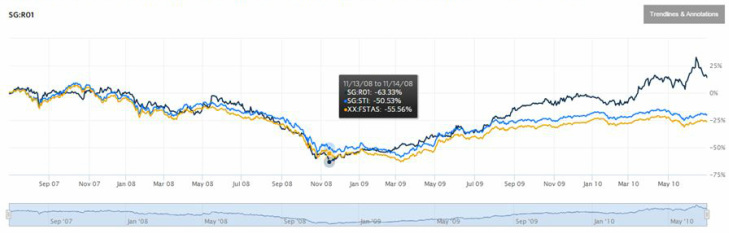
Figure 4b: Share price performance of RMG during the period of 1 July 2007 to 30 June 2010 vs STI Index and FTSE ST All-Share Index. (Source: wsj.com)
As we can see from Figures 4a and 4b above, RMG's share price plunged during the GFC and traded briefly for as low as S$0.550 per share vs around S$1.50 before the onset of the crisis for a decline of approximately 63% from the start of the period to bottom. By comparison, the STI index and FTSE ST All-Share Index declined about 51% and 56% respectively over the same period. This is despite the resilience of RMG's revenues and earnings throughout the crisis as we witnessed. At its lowest point, RMG traded at a mere valuation of 9.5x earnings, or just a quarter of the lofty 38.4x it is at today.
As we can see from Figures 4a and 4b above, RMG's share price plunged during the GFC and traded briefly for as low as S$0.550 per share vs around S$1.50 before the onset of the crisis for a decline of approximately 63% from the start of the period to bottom. By comparison, the STI index and FTSE ST All-Share Index declined about 51% and 56% respectively over the same period. This is despite the resilience of RMG's revenues and earnings throughout the crisis as we witnessed. At its lowest point, RMG traded at a mere valuation of 9.5x earnings, or just a quarter of the lofty 38.4x it is at today.
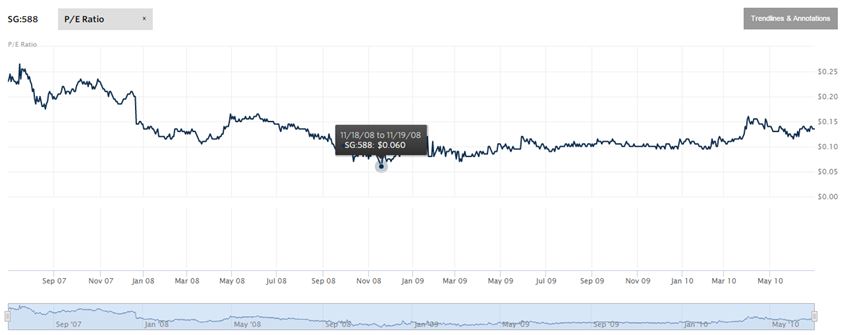
Figure 5a: Absolute share price of HMI during the period of 1 July 2007 to 30 June 2010
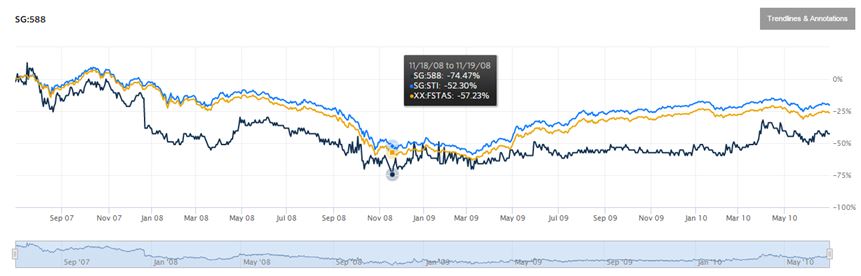
Figure 5b: Share price performance of HMI during the period of 1 July 2007 to 30 June 2010 relative to STI Index and the FTSE ST All-Share Index. (Source: wsj.com)
Similarly, HMI's share price plunged during the GFC with a fall of 74% from the start of the period to bottom vs the respective declines of 52% for the STI Index and 57% for the FTSE ST All-Share Index correspondingly. PE trend was not determined for HMI as it recorded negative earnings for FY09 and FY10.
Thus, it appears that while earnings of selected healthcare companies like RMG might be defensive during a downturn, their valuations and share prices might not hold up as well.
Our Recommendations
It seems obvious to us that the SGX-listed healthcare stocks in general are overvalued by most valuation metrics vis-à-vis the overall market. While the sector's earnings may be relatively resilient even in a major financial crisis like the GFC, the share prices and valuations have shown that they can be just as vulnerable, if not more, compared to the overall market. The sector's fundamentals may well be able to support a moderate growth rate of around 10% a year as suggested by Frost & Sullivan, although we feel that this is not sufficient to compensate for the over-optimistic valuations.
Investors should think thrice before chasing the hype especially with increased competition from new hospitals both in the public and private sector going forward. Several public hospitals in Singapore have either already been completed or are in the works over the next 10-15 years[ii]. On the private side, highly regarded hospitals such as Thailand's Bumrumgrad Hospital and Bangkok Hospital Medical Centre, both of which rank consistently amongst the top healthcare institutions in Asia alongside IHH Healthcare’s Gleneagles Hospital, provide strong competition for medical tourist dollars. Closer to Singapore, the Iskandar region has also seen the entry of a number of new players including the upcoming Thomson Iskandar Medical Hub, to be managed by Peter Lim's Thomson International group. Prospects going forward may, therefore, not be all rosy as the valuations would suggest.
We see little value to be had in any of the healthcare stocks listed in Singapore at the moment. That said, it is hard to predict when the valuation bubble will burst. Perhaps it will take another GFC-type crisis to bring a leading healthcare stock like RMG down to single-digit PE levels for investors to realise that the sector may not be as defensive as they thought.
[i] Median was used instead of mean as the FTSE All Share index covers a wide range of 178 stocks as at 19 June 2015 which would skew the data for mean if used.
[ii] Straits Times, 15 February 2014.
[ii] Straits Times, 15 February 2014.
 RSS Feed